Featured Chart for Friday, November 30
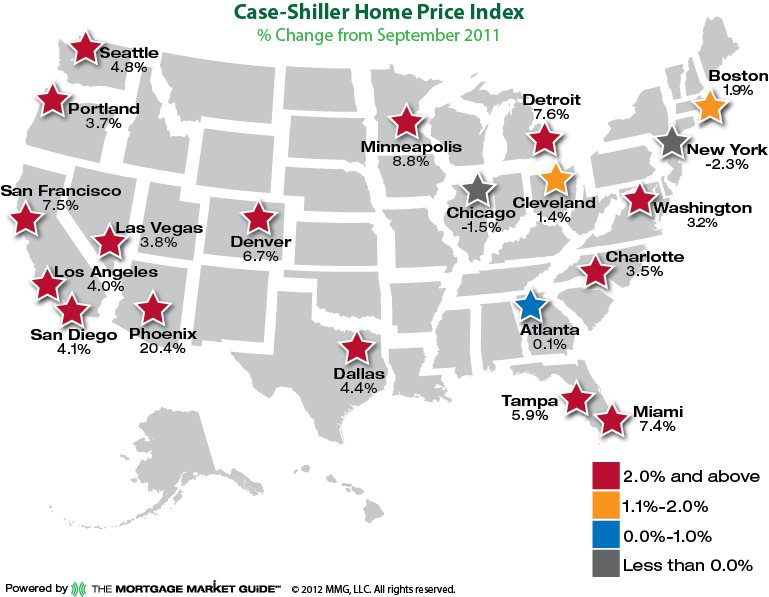
September Case Shiller Home Price Index
Home prices in the September Case Shiller 20-city
composite increased 3.0% from September 2011. From August to September, the
20-city composite was also up, posting a gain of 0.3%. The national composite
was up 3.6% in the third quarter from 2011 and was up 2.2% from the second
quarter of 2012.
The S&P/Case-Shiller Home Price Indices are published on the last Tuesday of each month at 9:00 am ET. They are constructed to accurately track the price path of typical single-family homes located in each metropolitan area provided. Each index combines matched price pairs for thousands of individual houses from the available universe of arms-length sales data.
The S&P/Case-Shiller Home Price Indices are published on the last Tuesday of each month at 9:00 am ET. They are constructed to accurately track the price path of typical single-family homes located in each metropolitan area provided. Each index combines matched price pairs for thousands of individual houses from the available universe of arms-length sales data.
Syndicate this chart through social media
platforms:
Bad Credit Loans No Brokers provide the individual the amount needed before your next payday, along with flexible repayment which will help in meeting all their needs at the right time.
ReplyDelete3 Month Loans Uk
Loans For People With Benefits
Bad Credit Unemployed Loans